The Attention Pathway: How Attention to Advertising Works
Advertisers want to pinpoint exactly what elicited attention when evaluating media performance, but disentangling the impact of media and creative can be challenging. To illustrate how they work together over the course of an impression to drive attention and outcomes, Adelaide developed “The Attention Pathway.”
High-quality media placements offer high attention potential
Interesting creative attracts and holds attention
Strong branding ensures the ad makes a lasting impression
For advertising to work, it needs to be noticed by the target audience—this is largely media’s responsibility. The attributes of media placements, such as clutter, placement size, and page geometry, shape the environment that funnels attention to creative.
After a media placement creates the opportunity for attention, creative capitalizes by holding attention for the time necessary to deliver the ad’s message to audiences. In the final step of this process, the attention captured and retained in the first two phases offers advertisers an opportunity to imprint a memorable brand message.
A key indicator of media quality is its ability to pave the way for creative to hold the audience’s attention. By separating the impact of media quality from that of creative relevance and audience, Adelaide’s AU metric helps marketers avoid the unintended consequences of optimizing all three inputs simultaneously.
Read Adelaide’s guide, “The Attention Pathway and How to Measure It,” created with the Association of National Advertisers, to learn more.
If no one notices your advertising, everything else is academic.”

Putting the Attention Pathway Into Practice
Adelaide’s AU attention metric is generated by a machine learning model that evaluates hundreds of media quality signals, eye-tracking data, and full-funnel outcome data. In display and video placements, these signals fall into categories like clutter, placement position, coverage, and in-view duration.
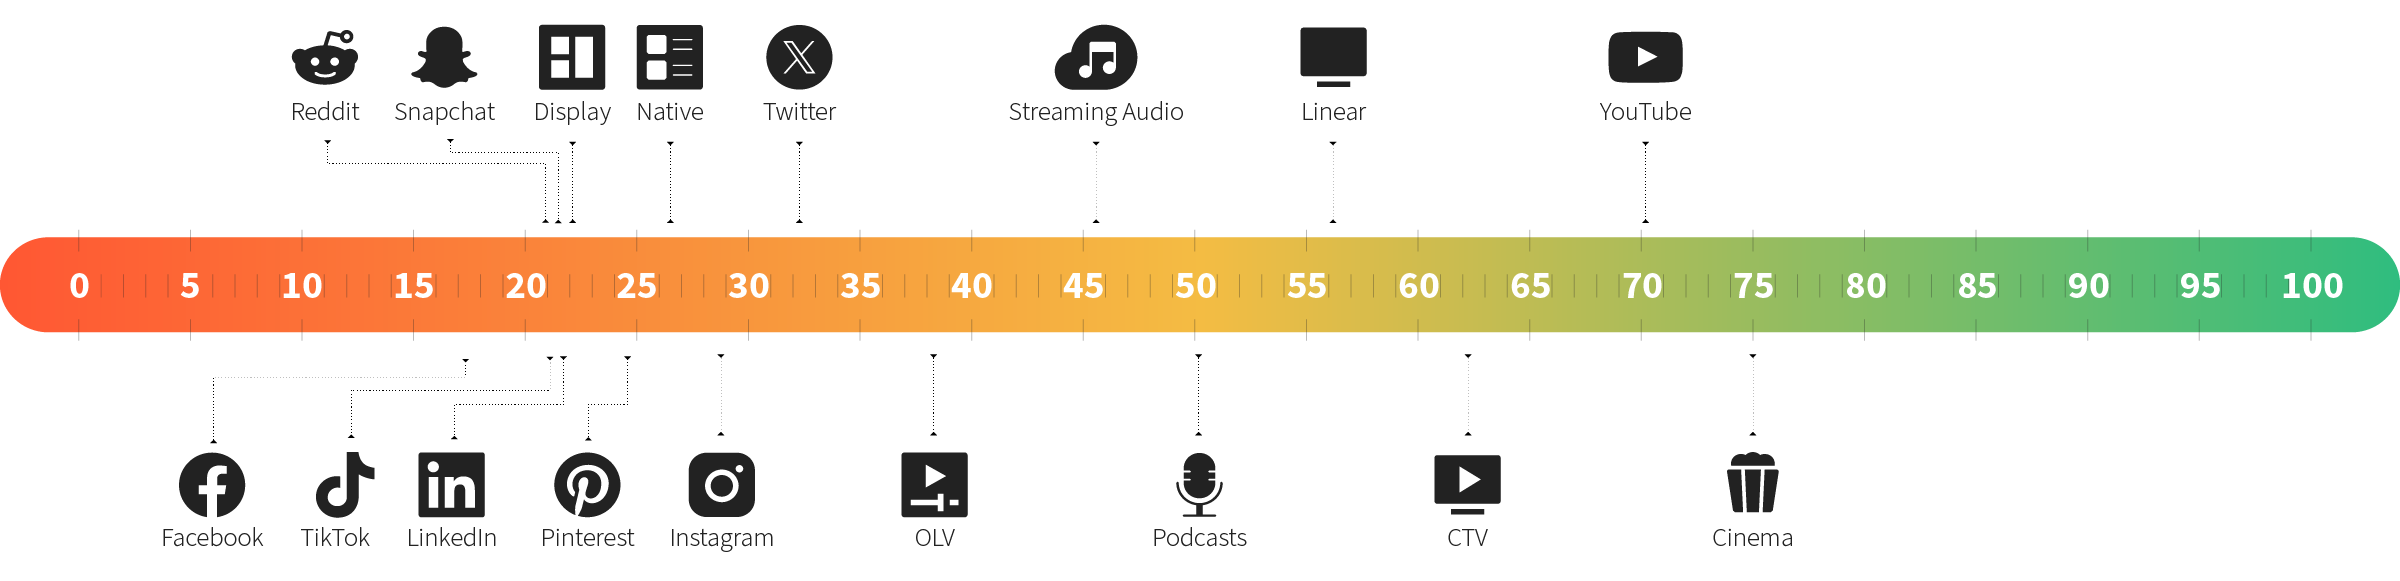
AU covers 90% of a typical advertiser’s spend, including web (display and OLV), Walled Gardens (Facebook/Instagram, YouTube, Twitter, Snapchat, Pinterest, LinkedIn, Reddit, TikTok), Connected TV (CTV), Linear TV, and Audio. Separate AU models are constructed for each channel, but attention scores are normalized across media experiences, enabling meaningful cross-channel quality comparisons.